Forum Replies Created
-
AuthorPosts
-
-
2025-06-24 at 10:09 am #48818
 Patiwat Sa-angchaiKeymaster
Hi Aung
from your problem you can follow this
1. Right-click on the layer that is not displaying, then choose “Repair Data Source” to point it to the correct file location.
2. Go to Project > Properties > General, and check or adjust the “Save paths” setting. If your files have been moved, make sure it’s set to “Relative” only if the folder structure is the same. Otherwise, switch to “Absolute” paths to avoid broken links.QGIS just got a missing link point to your file.
-
2025-06-22 at 11:21 am #48807
 Patiwat Sa-angchaiKeymaster
Hi Aung, nice to meet you!
Thanks for sharing your experience — I’ve seen similar reports from other macOS users.This is actually a known issue on macOS. There have been bug reports that QGIS project files (especially .qgz) sometimes cannot be opened directly by double-clicking from Finder. However, if you open the project from within QGIS itself using File → Open Project, it usually works fine.
Alternatively, you can try saving your project as a .qgs file (uncompressed XML format) on Windows before moving it to macOS — that often avoids the issue altogether.
Unfortunately, I don’t have access to a macOS device to test different QGIS versions directly, but this workaround has helped other users with similar setups.
Hope this helps!
-
2024-07-01 at 9:57 am #44568
 Patiwat Sa-angchaiKeymaster
Hi Teerawat,
Yes “null” value cannot be display on map and in the example also have it. You will notice that we put the other layer under the prevalence layer to makes displayed correctly (it’s grey on map).
-
2024-07-01 at 9:51 am #44567
 Patiwat Sa-angchaiKeymaster
Hello Nichcha ans Teerawat
For this assignment total malaria column is not necessary in this assignment and not use in the scoring method. don’t wary on this column once the data table can connect to spatial data correctly(every village point has their own cases data).
anyway if you need to calculate it you can done by field calculator.
-
2023-07-11 at 1:19 pm #41255
 Patiwat Sa-angchaiKeymaster
Sorry for my mistake that not properly change the file name to “Malaria_Village_incidence.shp”.
and yes we’ll use “Malaria_Village_incidence.shp” as a point data for intersection. -
2023-07-11 at 9:53 am #41250
 Patiwat Sa-angchaiKeymaster
save selected feature is not the purpose of intersection method, even they result the same as intersecting point feature with polygon layer.
if you intersecting polygon or line as a input layer with polygon as a Intersect feature(cookie cutter) the result will difference. Save selected feature don’t change boundary of polygon or line but the intersection can cut the body of polygon or trim the line to math your intersect polygon boundary.
try intersection tool not the save selected feature because result is difference.
focus on 3 factor in the intersection tool
– input layer : feature you need to subset(can be point line or polygon). In this case = village point and stream
– Overlay layer : polygon layer you use as a boundary. In this case = result from select by expression malaria > 1000 in the practice.
– Intersection : the intersection result file.PS. checked selected feature will use when you do not need to generate new file for the intersection boundary but you need some feature was selected in overlay layer as a cookie cutter.
-
2023-07-03 at 5:38 pm #41198
 Patiwat Sa-angchaiKeymaster
No need for those setting QGIS already done On the fly for you once the feature was load to project. if you need the Meter measurment for this step try to working with feature in UTM coordinate reference system that already measure the map in meter unit.
-
2023-07-03 at 5:12 pm #41197
 Patiwat Sa-angchaiKeymaster
Can you please upload the capture screen of your work to google drive and reply to me with that link? I cannot figure out the problem you facing now because I can settup it properly on mine.
about the size of the map Please try setting up the map sacle to 5,500,000 on map item properties(in main properties of map item). the map become smaller with this setting.
-
2023-07-03 at 4:49 pm #41196
 Patiwat Sa-angchaiKeymaster
Some picture in the practical file might be slighly difference because sometime we setup the hold project befor capture the screen. Not to warry you will set is column up in next tutorial.
-
2022-08-06 at 1:33 pm #37511
 Patiwat Sa-angchaiKeymaster
Hello Jonard Chu
For the free Administrative boundary of the Philippines I found some free online data here.
https://data.humdata.org/dataset/cod-ab-phl?
Consider that the code for joining data for each boundary might be different.
For the rest of the file such as road or rail we can export from OpenLayer Map using the QuickOSM plugin in QGIS.
Follow this video for Plugin installation and usage.https://www.youtube.com/watch?v=2VmRUv0L8WE
Note that online data is not reliable but good enough to use with personal projects and display maps. If you need to produce the official release map please look for the official release data to do this job instead.
-
2022-08-06 at 1:16 pm #37508
 Patiwat Sa-angchaiKeymaster
Hello Aradhana K C
From your ms excel you need to export your result to .csv instead of saving it to .xlsx and you can export only single sheet at a time.
-
2021-07-10 at 3:46 pm #28233
 Patiwat Sa-angchaiKeymaster
Hello Navin
First of all check the layer arrangement of the layer you want to query it must be on top. then make sure you pick the correct table to query because QGIS can open many table at a time. if everything correct you should see the selected feature highlight in yellow (defaults color for QGIS). if that not work try working on one layer at a time and see what happen.
for the blue selection highlight in attribute table if you can do a selection correctly and don’t see highlight record it might be the record was randomly distribute try scroll down to see it. if it won’t highlight maybe cause by wrong setting in query, please try to slowly follow the instruction step by step if it show the same result it can be a machine error but I never see this kind of error before.
PS. please also check the selection tool can it select feature you want by clicking on it? it must be yellow highlight on feature you click.
Hope this help,
Patiwat -
2021-06-28 at 4:40 pm #28075
 Patiwat Sa-angchaiKeymaster
Hello all
Field “Total_malaria” was removed because its do not use in any calculation and not necessary to create. If you want to try you can make this field by a field calculator in Attribute table window follow the step in the picture.
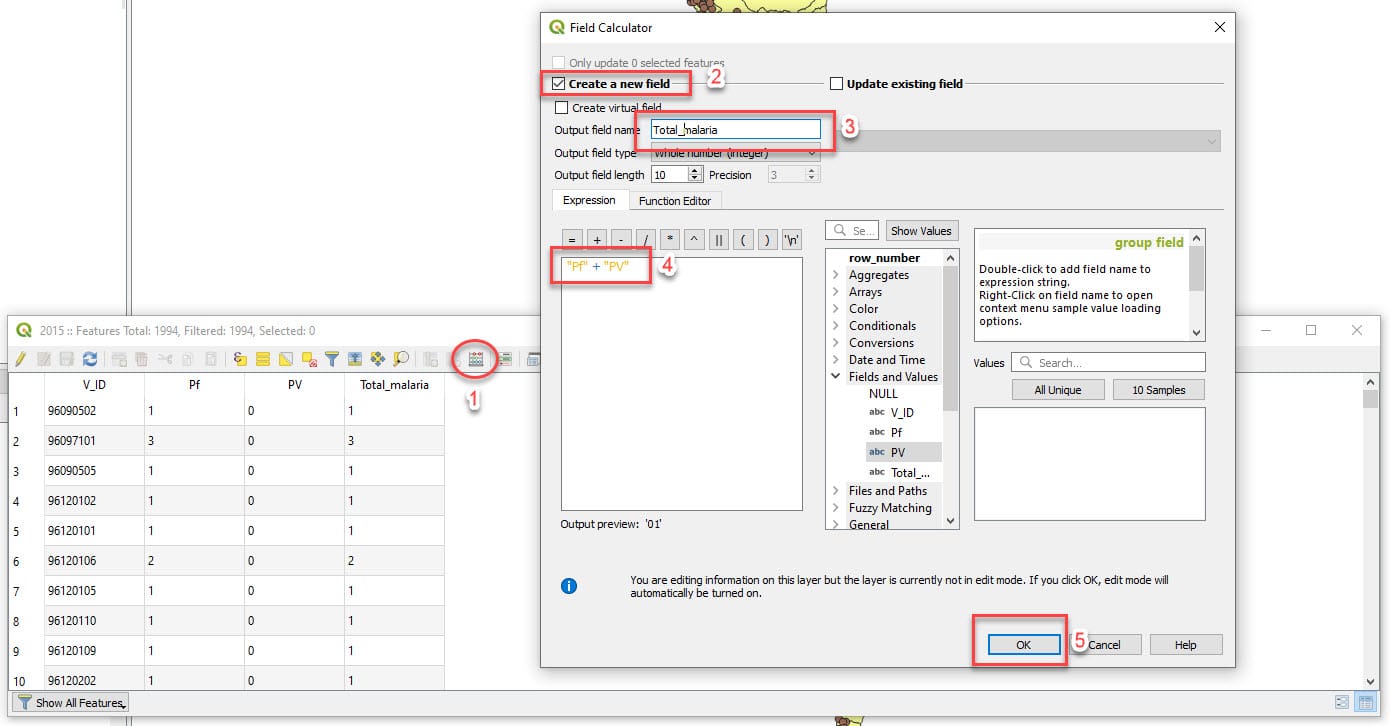
After the field was create click on toggle edit (button with a pencil) to stop editing table then save change to it.
-
2021-06-25 at 2:23 pm #28014
 Patiwat Sa-angchaiKeymaster
Hello Pacharapol
For railway layer in the assignment we don’t need you to classify type of it, so we remove the attribute detail of railway.shp for displaying purpose only. all you need for rail layer is to symbolize it as “topo railway” in symbole libary.
Thanks for you interesting question.
-
2021-06-19 at 2:05 pm #27880
 Patiwat Sa-angchaiKeymaster
Hello All
Sorry for some step in practice was skip. we will update it with your comment soon.
To add west_boundary.shp to project. It can be done the same way as adding vector file in page 12-13 and select west_boundary.shp. Once the west_boundary.shp was loaded drag it to top most layer then setting it follow the value in page 28. The layer will display as a boundary line of the area of interest.
For the rail way we can select symbol name “topo railway” in symbol library like showing in page 30 to setting category for road layer, all you need for rail way layer is select “topo railway” for it.
-
2020-05-13 at 11:25 am #19324
 Patiwat Sa-angchaiKeymaster
This cause by QGIS doesn’t know the unit of the map displayed. sorry for project coordinate setting method was skipped.
process to make scale bar display correctly is
1. remove your incorrect scale bar
2. set the project coordinate reference system(CRS)
3. add scale bar again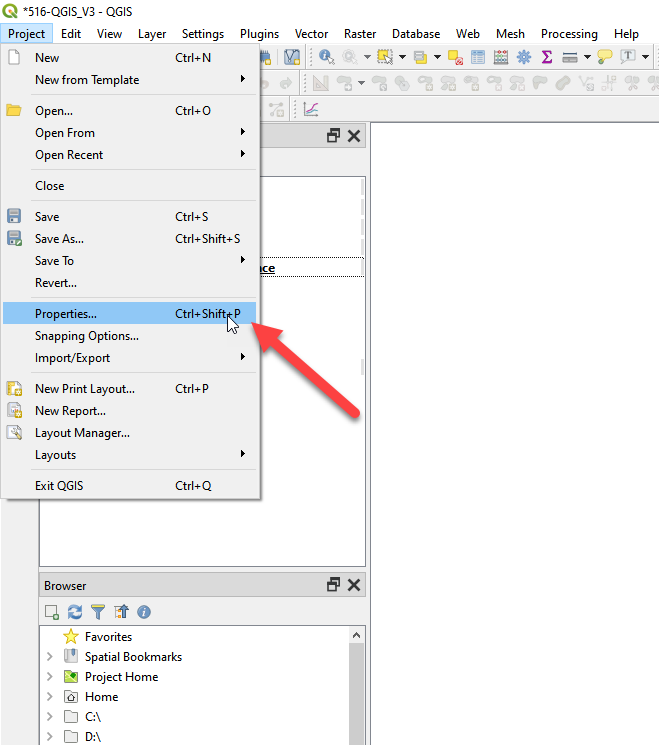
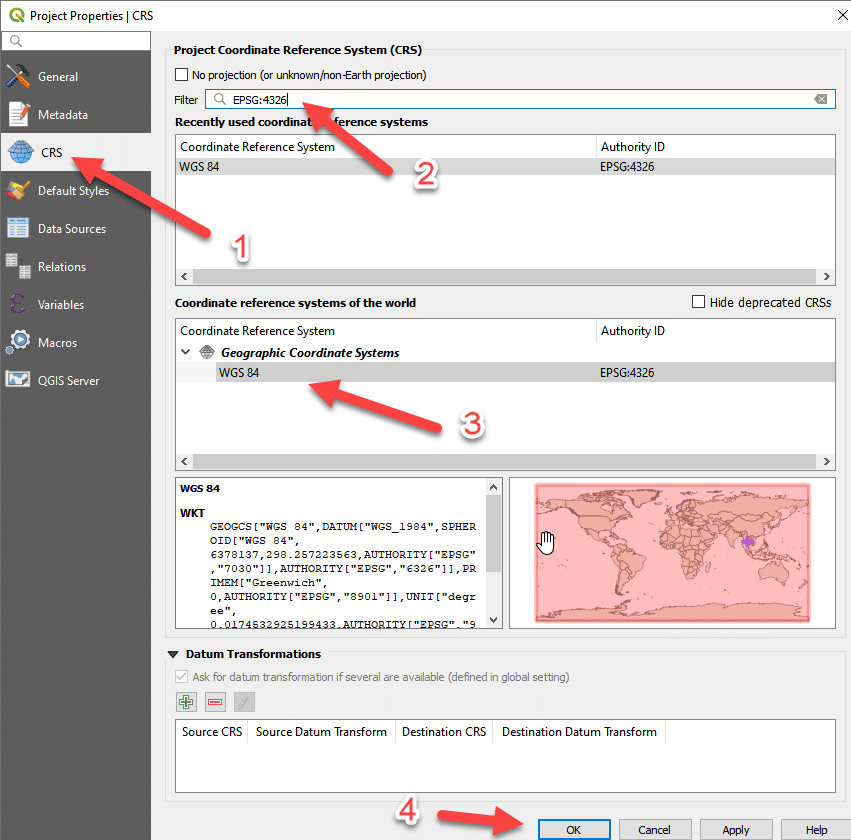
-
2020-05-12 at 1:22 pm #19231
 Patiwat Sa-angchaiKeymaster
please follow this krub.
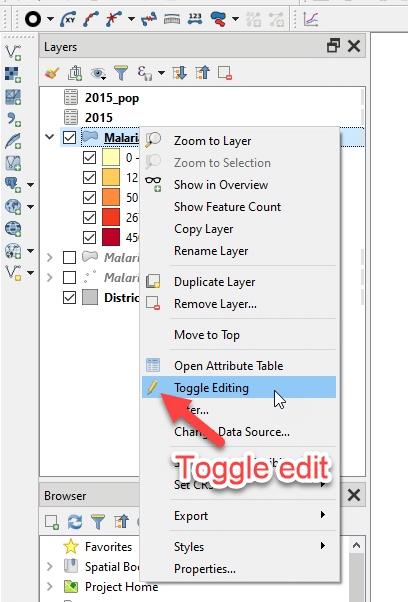
-
2020-05-11 at 12:02 am #19165
 Patiwat Sa-angchaiKeymaster
Hi Ameen, Both software is a desktop stand alone GIS software that cannot make a interactive map to distribute online. Both software can give you a fantastic map and complicated analysis its up to user experience. ArcGIS have more advantage by the big set of plugin in for many specific purpose and its very stable.
The application you talk about they also use GIS function for the location service in the other platform. I think ArcGIS online can handle those kind of work but need the expert to customization the dashboard back end. you can find out what ArcGIS dashboard can do and its example dashboard hear. https://www.esri.com/en-us/arcgis/products/arcgis-dashboards/overview
-
2020-05-10 at 11:03 pm #19160
 Patiwat Sa-angchaiKeymaster
Use “Move item content” in the tool box(tool on the left of the map layout screen) and scroll mouse wheel to adjust the map size as you need or you can make it more precise by put the map scale in main property of the map item.
-
2020-05-10 at 1:47 pm #19118
 Patiwat Sa-angchaiKeymaster
You need to open the file in to a new project and rearange it to make a result map. No need for recalculate everything again.
-
2020-05-09 at 11:28 pm #19103
 Patiwat Sa-angchaiKeymaster
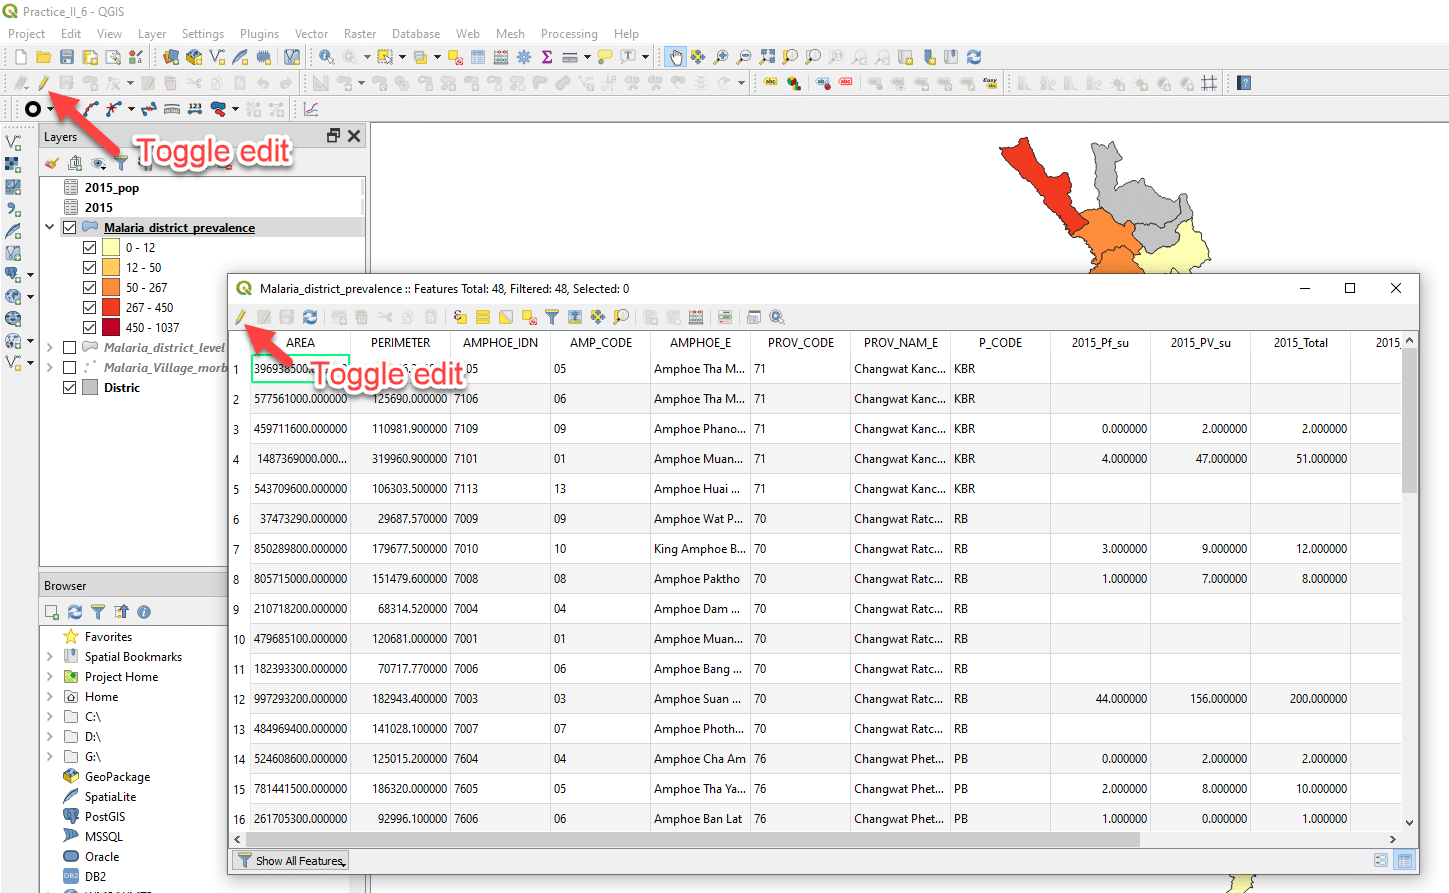
Hello Tullaya and Chanapong. we can also work in attribute table window like this.
1. Clik toggle editing mode.(the icon with pencil)
2. Click Delete field(Ctrl+L) then select column you need to delete then click OK
3. Save edit(diskette with pencil icon).
4. Clik toggle editing mode again to stop editing.In the GIS software we can do the same thing in many way and some time its like a short cut. if you can find the difference way to do the same thing easier please share.
-
2020-05-01 at 1:57 pm #18841
 Patiwat Sa-angchaiKeymaster
Yes.
Most of Thailand administrative boundary map come with standard administrative code.
2 digit for province.
4 digit for Amphoe(district).
6 digit for Tambon(subdistrict)
8 digit for village
10 digit for sub-village(we call “Moo”)To work with boundary data we need only 6 digit because in Thailand we doesn’t have boundary survey for village and sub-village (some village do survey but very few)
link to code of Ministry of Interior
http://www.moi.go.th/pls/portal/docs/PAGE/MOI_2555/MOI/FIRST_PAGE/CODE%20DOPA/02CODE_0.PDFEven the data you get come with the administrative code. You need to verify it before you apply the analysis because sometime difference data provider use difference code especially when you work with sub-district or smaller level.
-
2020-05-01 at 1:28 pm #18840
 Patiwat Sa-angchaiKeymaster
For Thailand Vector and raster data you should join the facebook group name “Thaivaluer”. In this group they share many of interested data in various format and they all free to access.
For the official shape file to reference you should ask the department or unit that you deal with because in some case they use difference boundary to work with and some department you need to buy it.
-
2023-07-03 at 4:44 pm #41195
 Patiwat Sa-angchaiKeymaster
For uploading project file
To send the project all you need is to send .QGZ of your project within the zip file. The rest of component we will connect it to our file to preview your result compare with your screenshot, no need for all of the raw data you downloaded.For precision of population layer
This precision number use to show the precision value in your legend showing up in the Layer panel. This setting in poulation layer it will show no difference because the population data is in integer format. if you set it to minus it will showing the round-up value for you in your legend. -
2022-08-03 at 9:19 am #37441
 Patiwat Sa-angchaiKeymaster
Hello Muhammad
For your problem about downloading QGIS.
Its might cause by your internet connection and its speed.please try download version 3.1 (about 300MB. smaller than the lates version but work fine with this workshop)from link below.
https://drive.google.com/drive/folders/1Sbwg61_e9Z9dtsVHvq0UGUZLTWrZ1fRO?usp=sharing
This link is locate on our google drive, thats should make difference to downloading from original website.
If you cannot done downloading please lets me know.
Nice to see you in our workshop!!
Patiwat
-
-
AuthorPosts
