Forum Replies Created
-
AuthorPosts
-
-
2025-10-17 at 11:11 am #51423
 Pimphen CharoenKeymaster
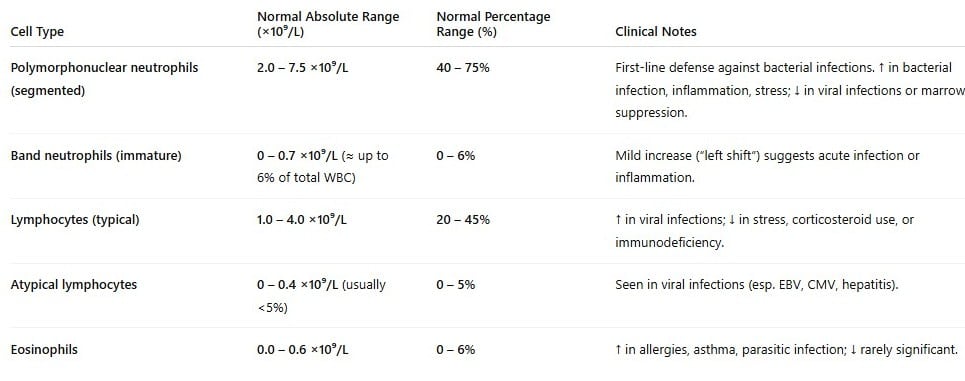
Thank you for your message and for checking carefully. I’ve checked with my clinician colleague, and the reference ranges below are also appropriate to use. You may note that these values can vary slightly between sources, so you can use these ranges for consistency across the dataset and cite the reference accordingly. Hope this helps!

Best,
Pimphen -
2020-08-28 at 9:25 pm #22052
 Pimphen CharoenKeymaster
Well done, you worked it out! One of problems that you will come across quite often in R is the format of an input. You need to find out which format is required and if your input is not in the correct format, you have to re-format it accordingly. This might involve commands as.vector, as.factor, as.numeric, as.character, as.matrix, etc. Perhaps the explanation below might also help. It does take time and practice to get familiar with R and we hope learning-by-doing should help you to go through this 🙂
To use confusionMatrix(data, reference), you need to have both data and reference as a factor (use help in R by typing ?confusionMatrix or just google the command, for ex. this link will also do
https://www.rdocumentation.org/packages/caret/versions/3.45/topics/confusionMatrix)# assuming you have “predicted2” as a factor
> predicted2 <- as.factor(c("no","yes","no","no","yes","no","yes","yes","yes","yes"))
> predicted2
[1] no yes no no yes no yes yes yes yes
Levels: no yes# assuming you have “actual” as a vector
> actual <- as.vector( c("no","yes","yes","no","yes","yes","yes","no","yes", "no"))
> actual
[1] “no” “yes” “yes” “no” “yes” “yes” “yes” “no” “yes” “no”> cbind(predicted2,actual)
predicted2 actual
[1,] “1” “no”
[2,] “2” “yes”
[3,] “1” “yes”
[4,] “1” “no”
[5,] “2” “yes”
[6,] “1” “yes”
[7,] “2” “yes”
[8,] “2” “no”
[9,] “2” “yes”
[10,] “2” “no”# to use confusionMatrix(data, reference), you need to have both data and reference as a factor
# you can use as.factor to do this however you should always print this out to double check. Sometimes you still need to play with it to get the right format. In this case you would also want it to have the same levels, for ex. Levels: no yes
> as.factor(actual)
[1] no yes yes no yes yes yes no yes no
Levels: no yes
> predicted2
[1] no yes no no yes no yes yes yes yes
Levels: no yes> confusionMatrix(predicted2, as.factor(actual))
Confusion Matrix and StatisticsReference
Prediction no yes
no 2 2
yes 2 4Accuracy : 0.6
95% CI : (0.2624, 0.8784)
No Information Rate : 0.6
P-Value [Acc > NIR] : 0.6331Kappa : 0.1667
Mcnemar’s Test P-Value : 1.0000
Sensitivity : 0.5000
Specificity : 0.6667
Pos Pred Value : 0.5000
Neg Pred Value : 0.6667
Prevalence : 0.4000
Detection Rate : 0.2000
Detection Prevalence : 0.4000
Balanced Accuracy : 0.5833‘Positive’ Class : no
-
2020-08-20 at 6:29 pm #21856
 Pimphen CharoenKeymaster
Good questions! Let me ask you a little bit further (and your peers are also very welcome to discuss!).
You are right. For two dimensions, we can simply visualise this in a scatter plot. Do you think how many dimensions we can do visualisation? and when we have many dimensions, is there a way to do so?
Based on the dendrograms from our iris example, can you make a good guess at which cut-off point on the tree can be used to infer a number of clusters and why? Is this the same guess between dendrograms generated from DIANA and AGNES?
For Elbow method, we are going to add R commands for generating the plot in a bit (in section 1.6). Thanks for letting us know!
-
2020-08-19 at 1:43 pm #21816
 Pimphen CharoenKeymaster
Great! Another simple approach to calculate a ‘35’ would be to take an average across attributes, e.g. suppose in the raw data, we have 3 attributes: ID.3 shows 10 20 30, ID.5 shows 2 4 6. Therefore, ID.35 would be 6 12 18. Then you can use this ID.35 to calculate distance matrix again for the next clustering.
-
-
AuthorPosts
